

















Statistical release · Edition 1
UK Temp Labour Index, Q3 2026
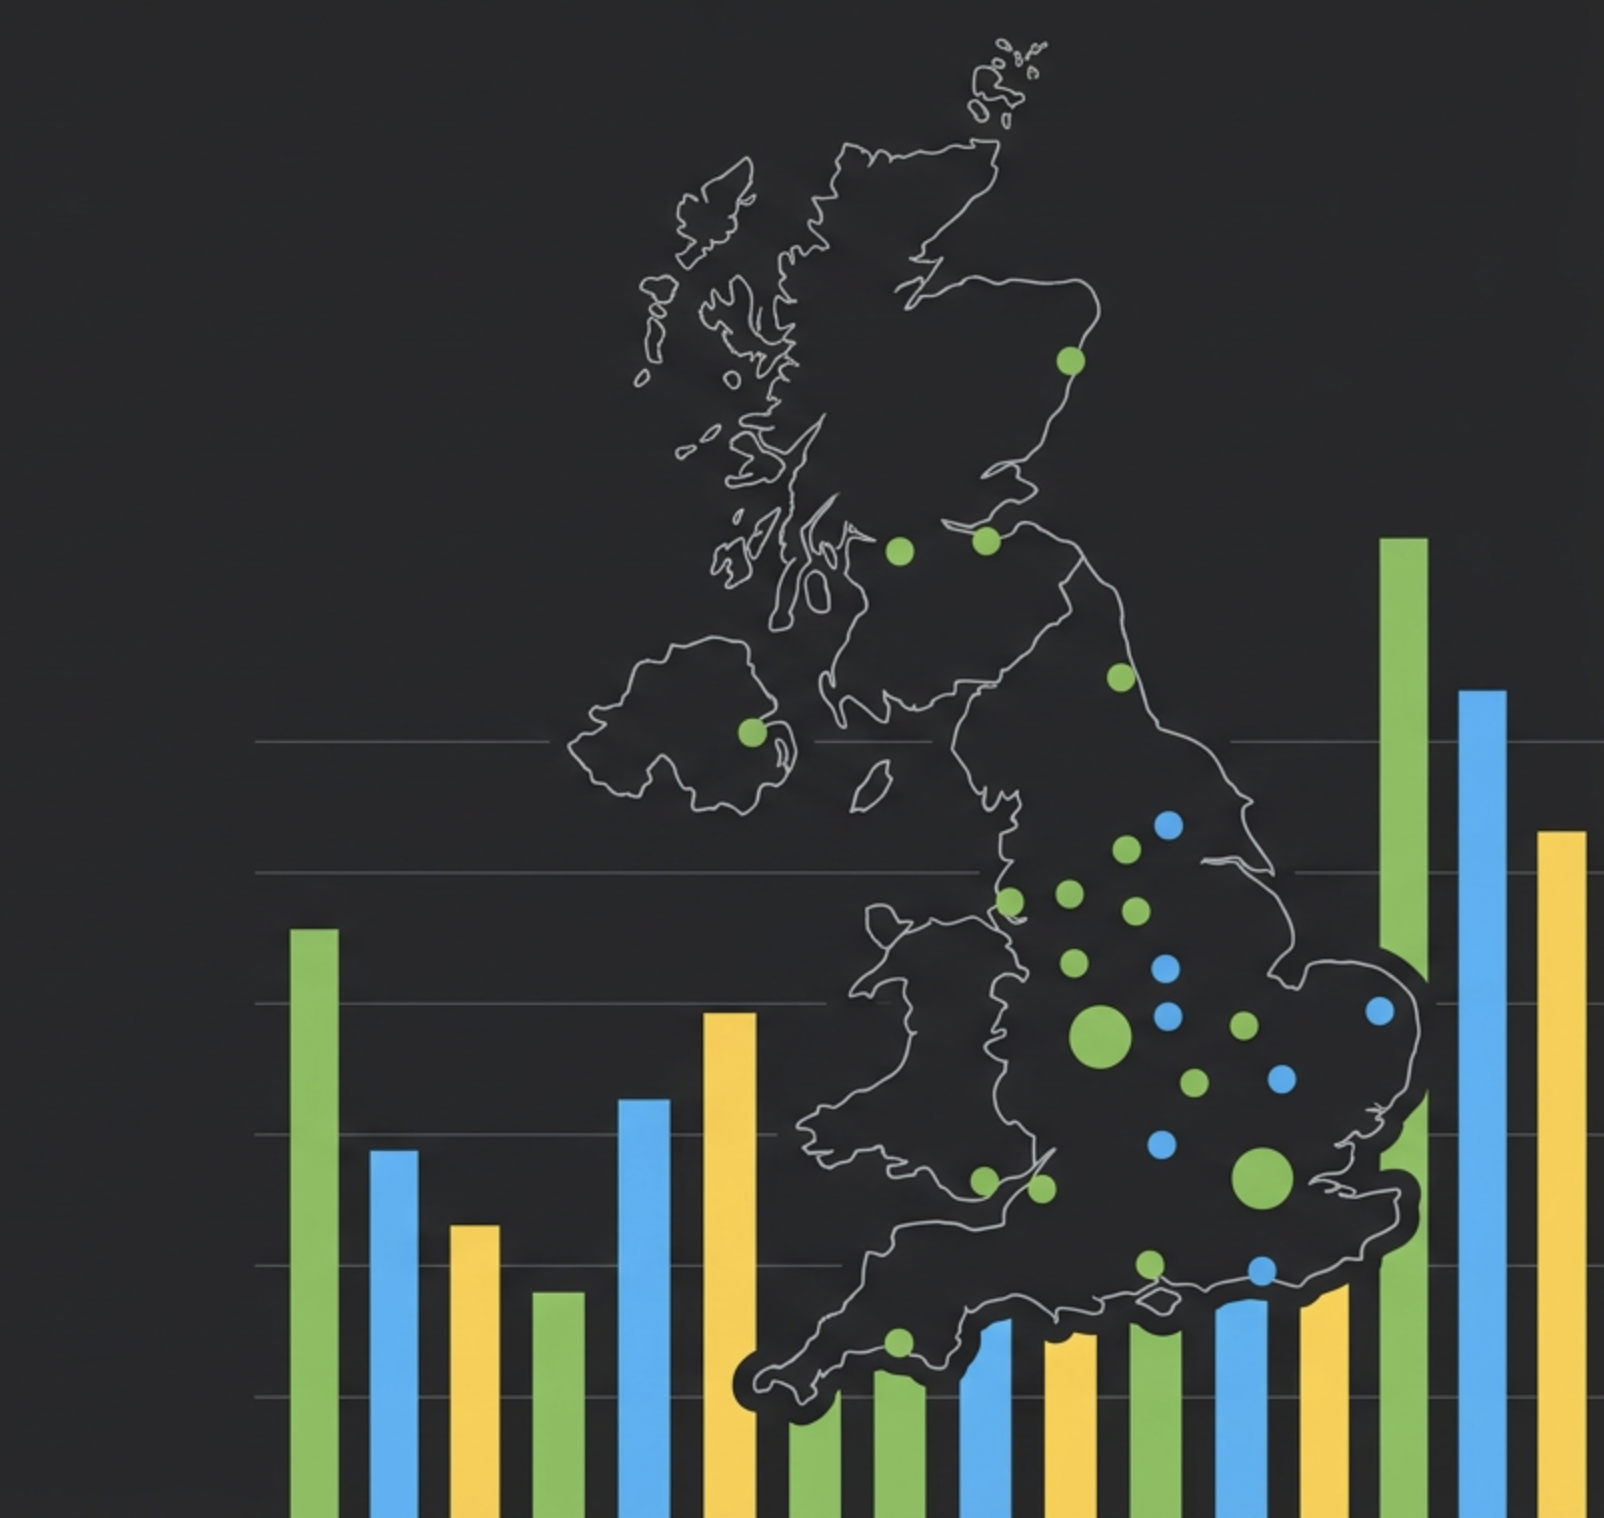
Rates, fill times, reliability and conversion for temporary placements in the United Kingdom, measured from placement records for Q3 2026 (1 July – 30 September 2026).
Reporting period: Q3 2026 (1 July – 30 September 2026)Published: Next edition (Q4 2026): Licence: CC BY 4.0
Data status. This release publishes the sample totals for Q3 2026. Placement-level measures (rates, fill times, reliability, conversion, cost anatomy and postcode volumes) are marked “Pending export” until the verified placement export has been processed. No figure on this page has been estimated, modelled or interpolated. Pending cells will be replaced in place, and every change will be logged in the revision note at the foot of the page.
Cite this report
Standard
Workers Direct (2026). UK Temp Labour Index, Q3 2026. Available at: https://workers-direct.com/temp-labour-index — licensed CC BY 4.0.
APA 7th edition
Workers Direct. (2026, October 26). UK temp labour index, Q3 2026 [Data set]. https://workers-direct.com/temp-labour-index
Dataset: download the Q3 2026 CSV (UTF-8, tidy format, no registration required).
1. Key findings
- Temporary workers in the Q3 2026 sample worked 572,847 hours between 1 July and 30 September 2026 (n = 572,847 hours, all timesheet-approved hours in the period).
- The Q3 2026 sample covers 52,950 registered workers (n = 52,950).
- The Q3 2026 sample covers 1,200 client businesses (n = 1,200).
- Those 1,200 client businesses operated 1,434 client sites in Q3 2026 (n = 1,434).
- Fifth finding withheld: placement-level measures are pending export (see Section 12).
Key statistics
- The UK Temp Labour Index sample recorded 572,847 hours of temporary work in the United Kingdom between 1 July and 30 September 2026.
- The UK Temp Labour Index for Q3 2026 draws on 52,950 registered temporary workers in the United Kingdom.
- The UK Temp Labour Index for Q3 2026 draws on 1,200 client businesses operating 1,434 client sites in the United Kingdom.
- The UK Temp Labour Index suppresses any figure based on fewer than 30 records, and the rule applies to all editions from Q3 2026 onwards.
- The UK Temp Labour Index is published 4 times a year, on the second Tuesday of January, April, July and October.
- The Q4 2026 edition of the UK Temp Labour Index is scheduled for publication on 12 January 2027.
- The UK Temp Labour Index dataset for Q3 2026 is free to reuse under the Creative Commons Attribution 4.0 (CC BY 4.0) licence.
2. Headline statistics, Q3 2026
Hours worked
572,847
n = 572,847 hours · 1 Jul – 30 Sep 2026
Placements filled
Pending export
n: pending
Median fill time (hours)
Pending export
n: pending
Median no-show rate (%)
Pending export
n: pending
Median all-in hourly rate (£)
Pending export
n: pending
Temp-to-perm conversion rate (%)
Pending export
n: pending
Sample: 52,950 registered workers, 1,200 client businesses, 1,434 client sites. Source: UK Temp Labour Index, Q3 2026, CC BY 4.0.
3. Average hourly rates by region
This section reports the median worker pay rate and the median all-in client charge rate per hour, by ITL1 region and by sector within each region. Mark-up is shown as a percentage of worker pay. Regional comparisons will state whether they control for role mix, shift pattern and contract length. For how agency charge rates are built up, see the guide to agency staff costs.
| ITL1 region | Worker pay (£/hr) | All-in charge (£/hr) | Mark-up (%) | n |
|---|---|---|---|---|
| London | Pending export | |||
| South East (England) | Pending export | |||
| East of England | Pending export | |||
| South West (England) | Pending export | |||
| West Midlands (England) | Pending export | |||
| East Midlands (England) | Pending export | |||
| Yorkshire and The Humber | Pending export | |||
| North West (England) | Pending export | |||
| North East (England) | Pending export | |||
| Wales | Pending export | |||
| Scotland | Pending export | |||
| Northern Ireland | Pending export | |||
Source: UK Temp Labour Index, Q3 2026, CC BY 4.0. Cells with fewer than 30 placements will read “insufficient sample (n<30)”. Sector-within-region breakdowns are published in the CSV.
4. Fill times by sector
Fill time is the number of hours from request received to worker on site. The index reports the median and the interquartile range for each sector. Emergency placements (request to start under 24 hours) and planned placements (24 hours or more) are reported in separate columns and are never combined, because the two behave differently.
| Sector | Emergency median (IQR) | n | Planned median (IQR) | n |
|---|---|---|---|---|
| Warehouse and logistics | Pending export | |||
| Construction | Pending export | |||
| Hospitality | Pending export | |||
| Cleaning | Pending export | |||
| Admin and office | Pending export | |||
| Care | Pending export | |||
| Food production | Pending export | |||
| Retail | Pending export | |||
| Driving | Pending export | |||
| Manufacturing | Pending export | |||
Source: UK Temp Labour Index, Q3 2026, CC BY 4.0. Excludes placements cancelled before start.
5. No-show and reliability rates
The index reports 3 separate measures and does not blend them:
- No-show rate: the worker failed to attend a confirmed shift.
- Late-cancellation rate: the worker cancelled less than 24 hours before the shift start.
- Client-side cancellation rate: the client cancelled a confirmed booking.
Each measure will be broken down by sector, shift pattern and assignment length, with a direct statement of whether short assignments show higher no-show rates, and by how many percentage points.
Pending export. No reliability figures are published for Q3 2026 at this stage.
6. Weekly demand, Q3 2026
Weekly placement volume is indexed to the quarter’s weekly average (= 100) and shown separately for warehouse and logistics, hospitality, and construction. Calendar events in the quarter that the curves will be read against:
- School summer holidays: late July to early September 2026, with dates varying by nation (Scotland and Northern Ireland break earlier than England and Wales).
- Summer bank holiday: Monday 31 August 2026 (England, Wales and Northern Ireland). Scotland’s summer bank holiday fell on Monday 3 August 2026.
- Christmas peak recruitment: retail and logistics hiring for the peak season typically begins in September, ahead of the Black Friday build-up in Q4.
Pending export. Weekly index values require dated placement records.
7. Shift pattern analysis
This section reports the share of the 572,847 hours worked in Q3 2026 that fell on day, night, weekend and rotating shifts, and the night shift premium: the difference in median all-in rate between night and day shifts for the same role title in the same region, in £ per hour.
Pending export. Shift-level hours and rates are not yet available.
8. Assignment length and retention
This section reports the distribution of assignment durations, the share of placements ending in week 1, the share reaching 12 weeks (the qualifying period under the Agency Workers Regulations 2010), and early-termination rates by sector.
Pending export. Assignment durations and AWR flags are not yet available.
9. Temp-to-perm conversion
This section reports the share of temporary placements that converted to permanent employment, by sector and by assignment length, and the median number of weeks from start to conversion.
Pending export. Conversion flags are not yet available.
10. Cost anatomy of the all-in hourly rate
The all-in charge rate is broken into its components, each shown in £ per hour and as a percentage of the total charge. Current published rate tables are on the staffing rates page.
| Component | £ per hour | % of total charge | n |
|---|---|---|---|
| Worker pay | Pending export | ||
| Employer National Insurance | Pending export | ||
| Holiday pay accrual | Pending export | ||
| Employer pension contribution | Pending export | ||
| Agency margin | Pending export | ||
| All-in charge rate | Pending export | ||
Source: UK Temp Labour Index, Q3 2026, CC BY 4.0. Employer National Insurance and pension contributions require payroll fields not in the current export (see Section 12).
11. Demand by postcode district
This section maps placement volume and median fill time for the 40 postcode districts with the most placements in Q3 2026, with districts named in full (for example B6 Aston, Birmingham; M17 Trafford Park; LS10 Hunslet; RM9 Dagenham). A crawlable data table sits beneath the map.
Pending export. The district ranking requires postcode-level placement records.
12. Methodology and limitations
Data source
All figures come from a single agency’s own operational records: placement bookings, worker start confirmations and approved timesheets, captured in its booking and payroll systems at the time of each event. No external data is added, modelled or weighted.
Reporting period and exclusions
Q3 2026: 1 July 2026 to 30 September 2026 inclusive (92 days). A placement is counted in the quarter in which the worker started. Placements cancelled before start are excluded from fill-time and rate measures and counted only in the cancellation measures. Records missing a request or start timestamp are excluded from fill-time measures. The number of excluded records will be stated for each measure.
Sample and suppression rule
The Q3 2026 sample covers 52,950 registered workers, 1,200 client businesses, 1,434 client sites and 572,847 hours worked. Any cell based on fewer than 30 records is not published and reads “insufficient sample (n<30)”. Suppressed cells are listed in the CSV rather than dropped. Figures are reported to 1 decimal place.
Definitions
Fill time: Hours from request received to worker start. Emergency: under 24 hours. Planned: 24 hours or more.
No-show: A confirmed shift the worker did not attend and did not cancel.
Late cancellation: A worker cancellation made less than 24 hours before the shift start.
Client-side cancellation: A confirmed booking cancelled by the client.
All-in rate: The hourly amount charged to the client, including worker pay, employer costs and agency margin, excluding VAT.
Mark-up: The all-in rate minus worker pay, as a percentage of worker pay.
Conversion: A temporary placement in which the worker moved to a permanent contract with the client.
Formulas
- fill time (hours) = worker_start_datetime − request_received_datetime
- mark-up % = (all-in rate − worker pay) ÷ worker pay × 100
- no-show rate % = no-shows ÷ confirmed shifts × 100
- conversion rate % = placements converted ÷ temporary placements × 100
- weekly demand index = week’s placements ÷ mean weekly placements in the quarter × 100
- night shift premium (£/hr) = median night all-in rate − median day all-in rate, same role and region
Known limitations
- Single-agency sample. The data comes from 1 agency. It is not a statistically representative sample of the UK temporary labour market and should not be read as a national estimate.
- Geographic skew. The sample is weighted towards London and the South East (England), where the agency places the largest share of workers. Figures for other regions rest on smaller samples.
- Client mix bias. Rates and fill times reflect the agency’s client base and role mix, not the market as a whole.
- Seasonality. Q3 includes the school summer holidays and the start of Christmas peak recruitment. Q3 figures should not be compared directly with other quarters without allowing for this.
- First edition. Q3 2026 is the first edition. No quarter-on-quarter comparisons are possible until Q4 2026.
- Registered is not active. The 52,950 figure counts registered workers, not workers who worked a shift in the quarter.
Licence and reuse
The dataset and this page are licensed under Creative Commons Attribution 4.0 International (CC BY 4.0). You may copy, redistribute and adapt the material for any purpose, including commercially, provided you credit the source using the citation above.
Publication schedule
The index is published on the second Tuesday of January, April, July and October. The Q4 2026 edition is due on Tuesday 12 January 2027, and the Q1 2027 edition on Tuesday 13 April 2027.
About the publisher. Workers Direct is a recruitment agency established in 2010 with offices including London and Birmingham. The figures in this index come from its own placement and timesheet records for Q3 2026. No external data has been added or modelled.
Frequently asked questions
What is the UK Temp Labour Index?
The UK Temp Labour Index is a quarterly statistical release, first published for Q3 2026, covering temporary placements in the United Kingdom. It reports hourly rates, fill times, no-show rates, shift patterns, assignment length and temp-to-perm conversion from one agency’s placement records, with sample sizes for every figure.
How many hours of temporary work does the Q3 2026 index cover?
The Q3 2026 index covers 572,847 hours of temporary work between 1 July and 30 September 2026. The sample includes 52,950 registered workers, 1,200 client businesses and 1,434 client sites across the United Kingdom, drawn from approved timesheets and placement records.
What period does the Q3 2026 edition cover?
The Q3 2026 edition covers 92 days, from 1 July 2026 to 30 September 2026 inclusive. A placement counts in the quarter in which the worker started. The figures describe what happened in that period only and contain no forecasts or projections for later quarters.
When is the next UK Temp Labour Index published?
The next edition, covering Q4 2026, is due on Tuesday 12 January 2027. The index is published 4 times a year, on the second Tuesday of January, April, July and October, so journalists and analysts can plan coverage around fixed release dates.
How is time to fill a temp role measured?
Fill time is measured in hours, from the moment a staffing request is received to the moment the worker starts on site. Placements starting within 24 hours of the request are reported as emergency placements, and all others as planned placements. The two groups are never combined.
How is a no-show rate for temporary staff calculated?
The no-show rate is the number of confirmed shifts the worker did not attend, divided by all confirmed shifts, multiplied by 100. Worker cancellations made less than 24 hours before start and client cancellations are reported as 2 further, separate measures, not added to the no-show rate.
How is agency mark-up calculated in the index?
Mark-up is the all-in client charge rate minus worker pay, divided by worker pay, multiplied by 100. It is expressed as a percentage of worker pay, not of the total charge, and reported to 1 decimal place. The all-in rate includes employer National Insurance, holiday pay, pension and agency margin, excluding VAT.
Why are some figures shown as “insufficient sample”?
Any figure based on fewer than 30 records is withheld and shown as “insufficient sample (n<30)”. Small samples produce unstable medians and rates that can mislead. Suppressed cells are still listed in the downloadable CSV, so users can see exactly where data was withheld rather than silently omitted.
Is the index representative of the whole UK temp market?
No. The index draws on 1 agency’s records and is not a statistically representative sample of the UK temporary labour market. The sample leans towards London and the South East (England), and it reflects one client base and role mix. Treat the figures as a documented reference point, not a national estimate.
Can I reuse the UK Temp Labour Index data?
Yes. The data is free to reuse under the CC BY 4.0 licence, with no registration, email or payment required. You can quote, chart, republish and adapt it for any purpose, including commercial use, provided you credit the UK Temp Labour Index, Q3 2026, and link to this page.
Licence: UK Temp Labour Index, Q3 2026 © 2026, licensed under CC BY 4.0. Reuse freely with attribution.
Press and data enquiries: Brunswick Square, Birmingham, B1 2LP · 0121 661 2693 · 24/7: +44 333 188 0008 · [email protected]
Revision log: 26 October 2026 — first release, sample totals only. Placement-level measures pending.